Like atoms, due to different configurations of electrons, molecules display
several energy levels. They are characterized by spin (singlet, doublet,
triplet,...) and by an angular moment, or, more precisely, by
Lz which is the projection of this moment parallel to the axis
of the molecule which represents a special direction. The respective eigenvalues
Λ are denoted with greek letters:
| Λ | ±1 | ±2 | ±3 | ±4 | ±5 | ... |
| Term symbol | Σ | Π | Δ | Φ | Γ | ... |
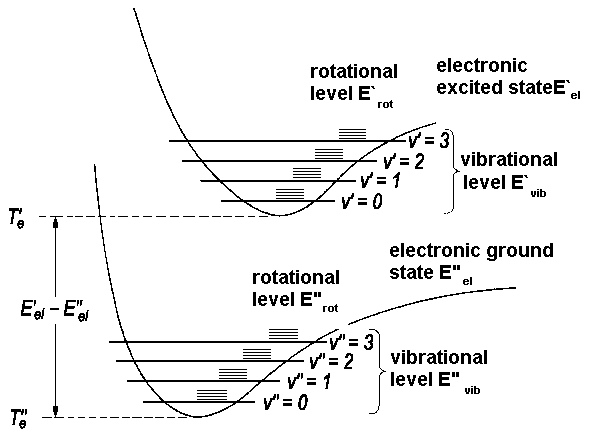
in analogy with S, P, D, F, G, ... to quantum numbers l = 0, 1, 2, 3, 4, ... for atoms. As a first approximation, we describe the energy of a diatomic molecule as a sum of electronic, vibrational and rotational energies
| E = Eel + Evib + Erot |
| E = Te + ωe(v + ½) + BJ(J+1), |
| ΔE = Eel + ΔEvib + ΔErot | ΔEel = E'el - E''el = T'e - T''e |
| ΔEvib = ω'e(v'+ ½) - ω''e(v''+½) | |
| ΔErot = B'J'(J'+1) - B''J''(J''+1) |
 |
Selection rules for transitions have been established. The table below contains the criteria for transitions and lists examples.
| allowed ΔΛ = 0, ± 1 and ΔS = 0 |
forbidden | |
| Example | 1Π ← 1Σ | 3Π ← 1Σ, since ΔS = 1 |
| 1Π ← 1Π | 1Π ← 1Φ, since ΔΛ = −2 | |
| 3Δ ← 3Δ | 3Δ ← 1Σ, since ΔS = 1 and ΔΛ = 2 |
If we consider the rotational states as well, it is required that the total angular momentum of photon and molecule remains constant. The selection rules depend on whether there are solely sigma states or whether an initial, a final state or both states have an electronic angular momentum J. The second case is referred to as "general" in the table below.
| for Σ ↔ Σ | ΔJ = -1 | P branch |
| ΔJ = +1 | R branch | |
| in general | ΔJ = -1 | P branch |
| ΔJ = 0 | Q branch | |
| ΔJ = +1 | R branch |
I.e., ΔJ = 0 is allowed since, within the system, there is at least one state with an electronic angular momentum that increases or decreases during transition.
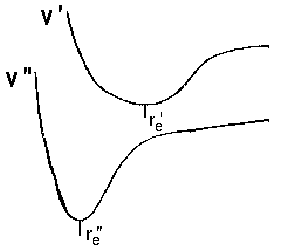
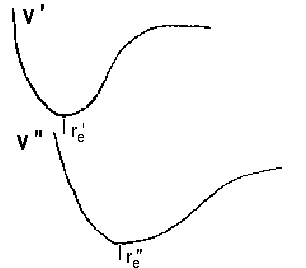
No selection rules exist for changes of the vibrational state. This is attributed to remarkable differences in equilibrium distance between re' versus re'' and frequency ωe' versus ωe''. In terms of quantum mechanics, the initial and final potential curves differ. As a consequence, we deal with two wavefunctions Ψv and obtain different series of vibrational states ν' and ν'' and the respective eigenvalues. Apart from this, the Franck-Condon-principle allows to calculate the probability of a transistion to some vibrational level of an excited state, i.e. the intensity of lines that reflect such transitions. An overlap of the following kind is the base to determine the probability as a function of v' and v''.
|∫Ψv'*·Ψv''·dτ|2
The obtained values have been named Franck-Condon-Factors.
| ν0 = Eel' - Eel'' + ωe'(v' + ½) - ωe''(v'' + ½) |
If we choose a transition v' ← v'', we expect the wavenumbers for the peaks within the P-, R- und Q-branch as given in the table below. The ratio of intensities for the three branches are decribed by the Hoenl-London-Factors.
| ΔJ = +1 | R branch | νR = ν0 + 2Bv' + (3Bv' - Bv'')J'' - (Bv'' - Bv')J''2 | J'' = 0, 1, 2, ... |
| ΔJ = -1 | P branch | νP= ν0 - (Bv' + Bv'')J'' - (Bv'' - Bv')J''2 | J'' = 1, 2, ... |
| ΔJ = 0 | Q branch | νQ = ν0 - (Bv'' - Bv')J'' - (Bv'' - Bv')J''2 | J'' = 1, 2, ... |
Now we want to find out in which way an increase in the rotational quantum number J" affects the position of lines. To get a comprehensive picture that is founded on data from all three branches of the transition, we modify the equations above.
| branch | substitution | range |
| R | J" = z-1 | for J" ≥ 0 |
| P | J" = -z | for J" > 1 |
This substitution and rearrangement of the addends yield the equations
| νR = ν0 + (Bv' + Bv'')z - (Bv'' - Bv')z2 | z = 1, 2, 3, ... |
| νP = ν0 + (Bv' + Bv'')z - (Bv'' - Bv')z2 | z = -1, -2, -3, ... |
Note that we recieved one equation ν(z). We further introduce ΔB = Bv'' - Bv' and B = ½(Bv'' + Bv') as abbreviations and get one expression for the spectral position of transistions with ΔJ = ±1.
| ν = ν0 + 2Bz - ΔBz2 |
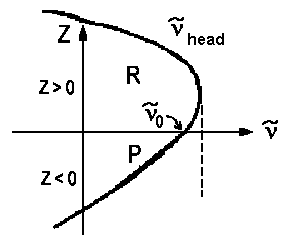
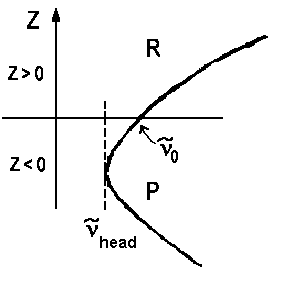
An analogous derivation with a quasi-substition J" = z yields a second equation ν = ν0 - ΔBz - ΔBz2 for lines of the Q branch . Usually we have |ΔB| < B, thus the lines of this branch accumulate close to ν0. If we plot a graph for pairs of ν(z) and z using the horizontal axis for the wavenumbers, we obtain the so-called Fortrat parabolas.
| a) red shadowed Prevalent case, electronic excitation increases bond length | ||
| ΔB > 0 re' > re" zhead>0 νhead>ν0 |
 |
 |
| spectrum |  | |
| b) blue shadowed in some rare cases, electronic excitation decreases bond length | ||
| ΔB < 0 re' < re'' zhead<0 νhead<ν0 |
 |
 |
| spectrum | 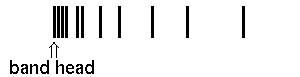 | |
In case a) the maximal wavenumber/frequency is found for high rotations of the R branch, in case b) the lowest wavenumber/frequency is found for the highest rotations of the P branch. The frequency ν0 for z=0 is the so-called band origin. The minima and maxima respectively are the so-called band head. Mathematically, they are determined as the zeros of function dν(z)/dz.
dν/dz = 0 = 2B - 2ΔBzhead
=> zhead = B/ΔB and νhead = ν0
+ B²/ΔB
![]()
Auf diesem Webangebot gilt die Datenschutzerklärung der TU Braunschweig mit Ausnahme der Abschnitte VI, VII und VIII.