A single atom or molecule radiates fully statistical light. However, the number of non-emitted particles (in the excited state) fades out in time in exponential form. We therefore obtain the amplitude E(t) of light source in a complex style:
E(t) = Eo e-gt eiwot + c.c.
where wo = (Em −
En)/h is the energy
difference between initial and resultant states.
 |
For t=0 there is excitation; for t > 0 we observe a signal. Now we would like to analyse the light wave by using a hypothetic spectral apparatus, i.e. the light is distributed (after passing through monochromator) into different frequencies w:
a(w) eiwt
The amplitude E(t) can be then represented as the overlapping in time of many monochromatic waves:
E(t) = 1/2p -¥∫+∞ a(w) eiwt dw
This is a so-called Fourier-Transformation which allows us to represent time-dependent quantities by using monochromatic waves having frequencies w (with amplitude a(w)). The coefficients a(w) are as follows:
a(w) = -¥ò+∞ E(t) e−iwt dt
We obtain the squared value of monochromatic light intensity: |a(w)|². For our exponentially decaying light amplitude E(t), we obtain the following estimation for the above-mentioned integral:
a(w) = −E {1/i(wo-w)-g - 1/i(wo+w)+γ}
Since wo+ w>> |wo-w| the second term is lower than the first one and therefore it can be neglected. One obtains the intensity distribution I(w) = |a(w)|² next:
I(w) = Eo² . 1/(w-wo)²+γ²
This spectral line is also referred to as Lorentz line. For practical
purposes it should be better to use the following formula:
| L(ν,νo) = 1/2πDnL/(n-no)²+(DnL/2)² |
where DnL is linewidth at half-maximum. Integrating this expression over the whole frequency range,we obtain 1:
-¥ò+∞ L(ν,νo) dν = 1
The linewidth DnL is also called the
natural linewidth and it is inversely
proportional to the decay time τ (it's said about natural lifetime):
| DnL = 1/2pt |
Typical values of the natural linewidth for a single stationary molecule
belong (1...10) MHz range.
 |
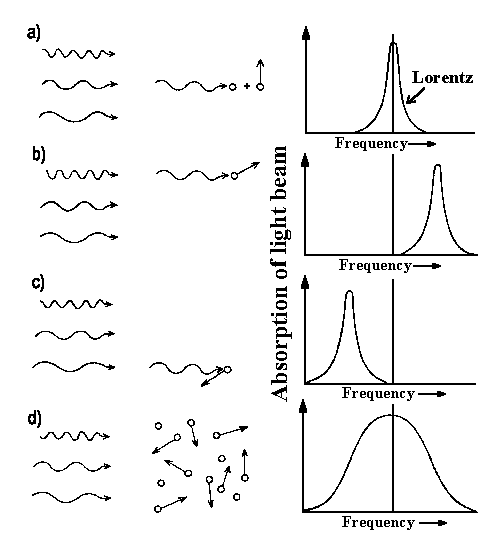
| Fig. 1: Particle movement relative to the incident light beam gives the frequency shift of absorbed light [a), b), c)]. When we have particle ensemble with different velocities as for thermal distribution particle velocities must be averaged over molecule velocity distribution law. |
Nevertheless particles can collide with each other and can easily change energies. This leads to linewidth broadening (collision broadening) which is also called homogeneous linewidth. When under atmospheric conditions, the collision time lies in the nanosecond range which gives rise to GHz broadening. Harder conditions conditions are for liquids: here the collision times lie in the picosecond range so that the width of a single transition belongs to THz range (it corresponds to a width of few nanometers for 300nm).
The nonhomogeneous linewidth exists when one can observe single atoms by using additional physical conditions, for example by installing atoms in solid body in different lattice positions with slightly different energies.
The gas resolution is also possible since particular particles have definite velocities v. Due to this fact such a particle absorbs the light at a slightly shifted frequency:
νD = νo(1 −v/c)
v is the velocity component in the direction of incident light (see fig. 1 a-c). Absorption occurs with higher frequency when a particle is flying in the same direction as a photon (fig. 1 b). Because of the frequency shift, one can easily obtain the particle's velocity (for instance, the velocity of interstellar gases in our Galaxy and velocity of reaction products).
Now this Doppler shift can be studied for thermal gas (in an equilibrium position): after Maxwell and Boltzmann we obtain the relative amount of atoms that have velocity component v in the direction of light beam (Derivation):
n(v) = (2kT/πm)½ e−(mv²/2kT)
(m = particle mass). With v = c. (νo-nD)/νo one can obtain the frequency-dependent intensity I:
I ~ e-(mc²/2kT)((νo-nD)/no)²
It is a typical Gauss profile. Since the linewidths are caused by Doppler
effects, one calls it a Doppler
profile. If now we introduce full linewidth at half-maximum
of intensity DnD and integrate over whole
frequency range obtaining integral intensity Io we finally
obtain: -¥ò+∞ I(ν,νo) dν =
Io, and then:
| I = Io (4 ln 2/π)1/² .1/DnD e−4ln2((νo-nD)/DnD)² |
| with |
| DnD = 2 νo/c(2 ln2 kT/m)½ |
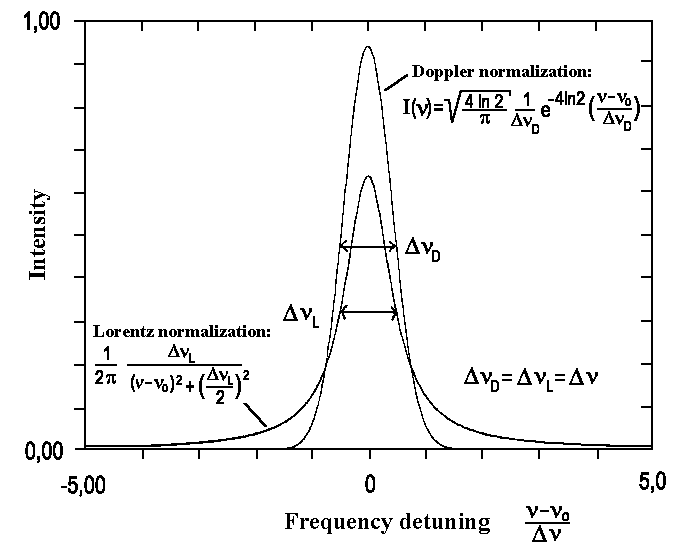
This so-called Doppler width DnD is proportional to the transition frequency, νo. Transitions in the visual range and near the UV range have Doppler widths beginning from ~ 1 GHz (T = 300 K). The hydrogen atoms have a very big width 30 GHz because of the small mass. In the visual spectral range DnD>>DnL and profiles are described by the above-mentioned Gauss curve. Conversely, for DnL>>DnD (for instance for microwave transitions or for collision broadening) spectral transition distribution is higher for the Lorentz profile than for the Doppler profile.
 |
| Fig. 2: Doppler and Lorentz line shapes comparison for the same width. Areas of both profiles are normalized by 1. |
If DnL and DnD are equal to each other then the observed spectral line is given by Gauss and Lorentz profiles convolution:
I(ν) = Io -¥ò+∞dνo{(4 ln 2/π)1/² .1/DnD e−4 ln2 ((νo-nD)/DnD)²}. {1/2pDnL/(n-no)²+(DnL/2)²}
This is the so-called Voigt profile. The exact solution of this integral cannot be found and it can be only found for each combination DnD, DnL by using numerical methods..
There are a lot of laser methods for which the Doppler shift doesn't have influence. In these cases, the transition and the molecular structure can be easily measured very accurately.
![]()
Auf diesem Webangebot gilt die Datenschutzerklärung der TU Braunschweig mit Ausnahme der Abschnitte VI, VII und VIII.