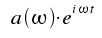
A single atom or molecule emits light spontaneously, but the number of atoms in an excited state falls in time with exponential characteristics. The following equation describes the amplitude E(t) for the source of light in a complex denotion.

The difference between the energies of the initial and the final state of the emitting species is introduced through ω0 = (Em-En)/h
Excitation takes place at t = 0; observation follows for t > 0. The wave of light is analyzed with a theoretical spectrometer, i.e. it is separated into monochromatic waves of frequency ω
Reversely, the amplitude E(t) is obtained as a superposition of such monochromatic waves:
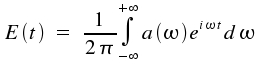
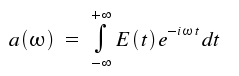
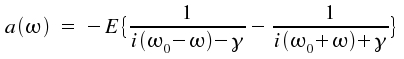
This is the so-called Fourier transformation which allows a description of time-dependent quantities by monochromatic waves of frequency ω and amplitude a(&omega). The coefficients a(ω) are given by:
The intensity of the monochromatic light equals the |a(&omega)|². For our light amplitude E(t), which falls exponentially, assessment of the integral above yields:
As ωo + ω >> |ωo−ω|, the second addend gets small and is neglectable. We therefore describe the spectral distribution of intensity I(ω) = |a(ω)|² as
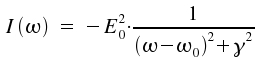
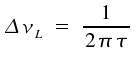
A spectral line of this kind is called Lorentz line. In practice, when comparing measured values with the predicted line shape, it is advantageous to replace ω and describe the line by
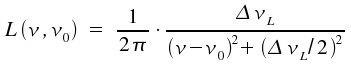
The graph of this equation is still Lorentzian as structure the term of the fraction is unaffected. ω is replaced by the width of the line at half the maximum intensity, ΔνL and the integral over all frequencies ν is set to 1.
Typical values of ΔνL for single and undisturbed molecules that perform transitions within the visible range of the electromagnetic spectrum are between one and 10 Megahertz.
 |
| Fig. 1: Movements of particles relative to the incoming beam of light shift the frequency of absorption [a), b), c)]. For an entity of species where, according to Boltzmann, a distribution of velocities is to be expected. The line shape reflects the sum of contributions of single particles with their distict velocity vectors. |
In contrast, the line width is said to be inhomogenous in situations where additional physical circumstances cause deviating energies, e.g. for certain atoms in the lattice of a solid.
In gases, variations of the particle velocities affect the spectrum. The observed frequency νD shows the following dependency of the movemens of the particle.
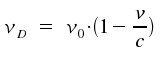
Note that v represents one component of the velocity; the amount of vector v parallel to the light. (compare Fig. 1). An absorption is shifted to higher frequencies for particles that share their direction with a beam of light (compare Fig. 1 b). Shifts in frequency ν. Therefore, shifts in frequency ν allow to determine of velocities of atoms, e.g. for materia in space or molecules just formed in some chemical reaction.
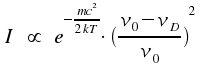
Now, we want to concentrate on this Doppler shift for a gas in thermal equilibrium. According to Maxwell and Boltzmann (derived here), there is a relative number n(v) of atoms with a velocity component parallel to a beam of light:
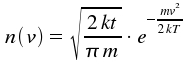
Here, m is the particle's mass. Using v = (ν0-νD)c/v0, we obtain intensity I as a function of frequency ν.
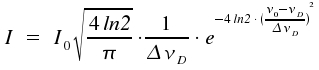
This is a typical Gaussian profile. As the width of lines is caused by the Doppler effect, such lines are said to show a Doppler profile. If we introduce the width at half-height ΔνD here too, and normalize the integral over all frequencies ν in a way that -∞∫+∞ = Io, we get the following equation:
 | mit | 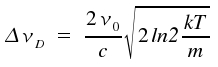 |
We recognize the so-called Doppler width Δν to be proportional to the frequency of the transition ν0. For transitions that cause lines within the visible or the near UV part of the spectrum and temperatures around 300 Kelvin, these lines typically have widths in the range of one Gigahertz. Due to their low mass, hydrogene atoms display exceptionally high Doppler widths of around 30 GHz. For the visible part of the spectrum, ΔνD is usually much greater than ΔνL. This prevents Lorentz characteristics from becoming visible and experimentally obtained profiles are gaussian. In contrast, for transitions within the microwave range or for extreme collision broadening, ΔνD gets much smaller than ΔνL. In such cases, the real line shape suits well to the profile of a Lorentzline.
 |
| Fig. 2: Comparison between Lorentz and Gauss profiles (Doppler) with identical integral and width at half-height. |
In case ΔνL and ΔνD have about the same magnitude, the observed spectral line appears to emerge from folding a gaussian curve profile with one of Lorentz type.
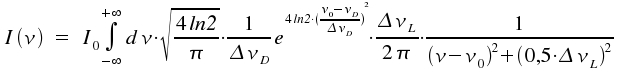
The respective profile is called a Voigt profile. As there is no closed-form solution of this integral, numeric methods for different combinations of ΔνL and ΔνD are applied. Novel laser techniques allow to investigate molecular transitions with excellent resolution as they prevent the line to be broadened by the Doppler effect.
![]()
Auf diesem Webangebot gilt die Datenschutzerklärung der TU Braunschweig mit Ausnahme der Abschnitte VI, VII und VIII.